ProbabilityIntroduction
Probabilities and likelihoods are everywhere around us, from weather forecasting to games, insurance or election polls. However, in the history of mathematics, probability is actually a very recent idea. While numbers and geometry were studied by ancient Greek mathematicians more than 2500 years ago, the concepts of probability only emerged in the 17th and 18th century.
According to legend, two of the greatest mathematicians,
To distract from the difficult mathematical theories they were discussing, they often played a simple game: they repeatedly tossed a coin – every heads was a point for Pascal and every tails was a point for Fermat. Whoever had fewer points after three coin tosses had to pay the bill.
One day, however, they get interrupted after the first coin toss and Fermat has to leave urgently. Later, they wonder who should pay the bill, or if there is a fair way to split it. The first coin landed heads (a point for Pascal), so maybe Fermat should pay everything. However, there is a small chance that Fermat could have still won if the
Pascal and Fermat decided to write down all possible ways the game could have continued:
Pascal wins
Pascal wins
Pascal wins
Fermat wins
All four possible outcomes are equally likely, and Pascal wins in
Pascal and Fermat had discovered the first important equation of probability: if an experiment has multiple possible outcomes which are all equally likely, then
Probability of an event =
In our example, the probability of Pascal winning the game is
What are Probabilities
A probability is a number between 0 and 1 which describes the likelihood of a certain event. A probability of 0 means that something is impossible; a probability of 1 means that something is certain.
For example, it is
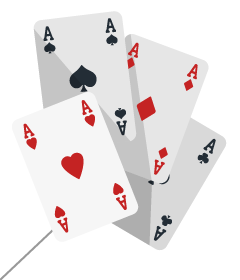
The probability of rolling a 6 on a die, or picking a particular suit from a deck of cards is


Now drag the following events into the correct order, from likely to unlikely:
We often use probabilities and likelihoods in everyday life, usually without thinking about it. What is the chance of rain tomorrow? How likely is it that I will miss the bus? What is the probability I will win this game?
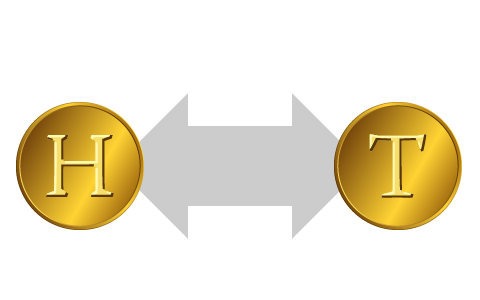
Tossing a (fair) coin has two possible outcomes, heads and tails, which are both equally likely. According to the equation above, the probability of a coin landing heads must be
Note that this probability is in between 0 and 1, even though only one of the outcomes can actually happen. But probabilities have very little to do with actual results: if we toss a coin many times we know that
Even events with tiny probabilities (like winning the lottery ![]() ) can still happen – and they do happen all the time (but to a very small proportion of the people who participate).
) can still happen – and they do happen all the time (but to a very small proportion of the people who participate).
Probabilities also depend on how much each of us knows about the event. For example, you might estimate that the chance of rain today is about 70%, while a meteorologist with detailed weather data might say the chance of rain is 64.2%.
Or suppose that I toss a coin and cover it up with my hands – the probability of tails is 50%. Now I peek at the result, but don’t tell you. I know for certain what has happened, but for you the probability is
There are many different ways to think about probabilities, but in practice they often give the same results:
The classical probability of landing heads is the proportion of possible outcomes that are heads.
The frequentist probability is the proportion of heads we get if we toss the coin many times.

The subjectivist probability tells us how strongly we believe that the coin will land heads.
Remember that while probabilities are great for estimating and forecasting, we can never tell what actually will happen.
Predicting the Future
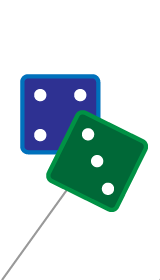
If we roll a die, the result is a number between 1 and 6, and all outcomes are equally likely. If we roll two dice at once and add up their scores we can get results from
Some results can only happen one way (to get 12 you have to roll + ) while others can happen in multiple different ways (to get 5 you could roll + or + ).
This table shows all possible outcomes:
2 | 3 | 4 | 5 | 6 | 7 | 8 | 9 | 10 | 11 | 12 |
The most likely result when rolling two dice is 7. There are
The least likely outcomes are 2 and 12, each with a probability of
It is impossible to forecast the outcome of a single coin toss or die roll. However, using probability we can very accurately predict the outcome of many dice.
If we throw a die 30 times, we know that we would get around
In this animation you can roll many “virtual” dice at once and see how the results compare to the predicted probabilities:
Rolling Dice
We roll
Notice how, as we roll more and more dice, the observed frequencies become closer and closer to the frequencies we predicted using probability theory. This principle applies to all probability experiments and is called the law of large numbers.
Similarly, as we increase the number of dice rolled at once, you can also see that the probabilities change from a straight line (one die) to a triangle (two dice) and then to a “bell-shaped” curve. This is known as the central limit theorem, and the bell-shaped curve is called the normal distribution.